IF YOU ARE A BRAND (NETMONITOR USER)
This module is accesible from Price monitoring > Analytics> Deviation by stores

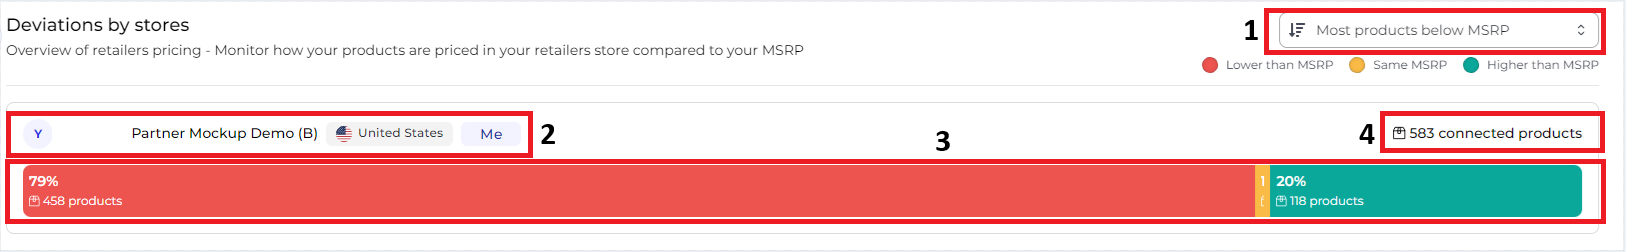
This section enables you to directly compare your Manufacturer's Suggested Retail Price (MSRP) with the prices set by your retailers. The screen is divided into two main sections:
The first bar displays the complete set of connected products from your catalog. This allows you to easily assess how your MSRP aligns with the prices offered by retailers for each product, providing valuable insights into your pricing strategy and competitiveness in the market.
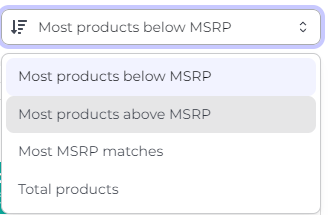
1.Filter by:
-
-
Most Products Below MSRP: By default, this section displays retailers sorted in descending order based on the number of products priced below your MSRP.
-
Most Products Above MSRP: This section ranks retailers in descending order according to the number of products priced above your MSRP.
-
Most MSRP Matches: Here, retailers are organized in descending order based on the number of products that align with your MSRP, making it easy to identify those that adhere to your pricing.
-
Total Products: This section sorts retailers by the total number of connections in descending order, providing a clear view of which retailers have the most products linked to your catalog.
2.Name of Your Store: This section displays the name of your store, allowing you to easily identify your catalog in relation to the pricing data.
3.Product Distribution Bar: This visual representation shows how many of your products are priced above, at, or below the MSRP compared to the total number of connected products. This helps you quickly assess your pricing strategy across your catalog.
4.Total Number of Products Connected vs. the Retailer: This section indicates the total number of products linked to each retailer, providing insights into your catalog’s reach and the retailer's inventory in relation to your offerings.
In the second bar, you'll find detailed information for each retailer. This section provides insights specific to individual retailers, allowing you to analyze their pricing strategies and product offerings in relation to your MSRP. You'll be able to see key metrics, such as pricing deviations, the number of connected products, and how each retailer's prices compare to your MSRP for the products they offer. This detailed data helps you make informed decisions about your pricing strategy and competitiveness in the market.

1.Name of the Retailer: Displays the name of the retailer, which can be either a marketplace or a direct web retailer.
2.Deviation Average: This metric shows the overall pricing position of the retailer compared to your MSRP, indicating whether their prices are generally higher or lower.
3.Number of Connected Products vs. the Retailer: This section reveals the total number of products linked to that specific retailer, helping you understand the breadth of your catalog available through their platform.
4.Product Distribution per retailer: This visual element illustrates how many of your products are priced above, at, or below the MSRP, relative to the total number of products connected to that retailer. It provides a quick overview of pricing trends and competitiveness within that specific retail environment.